Vorläufiges Ergebnis zur Landtagswahl 2013 am 15.09.2013
Stimmkreis Miltenberg - Landkreis Miltenberg - Stadt Miltenberg
Es wurden alle Stimmbezirke ausgewertet.
 Diagramm
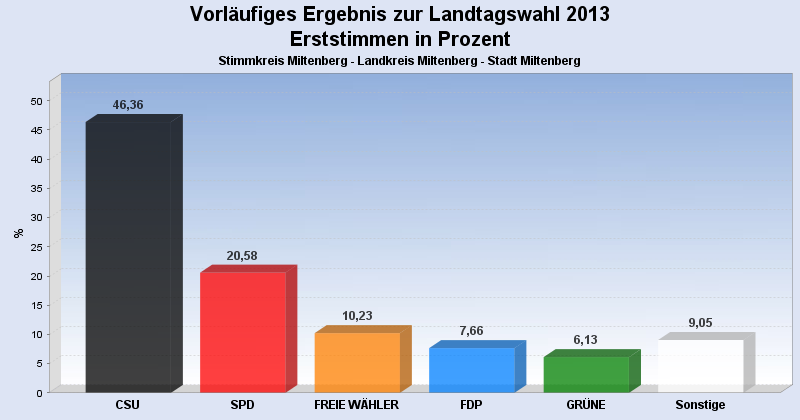
 Seitenanfang
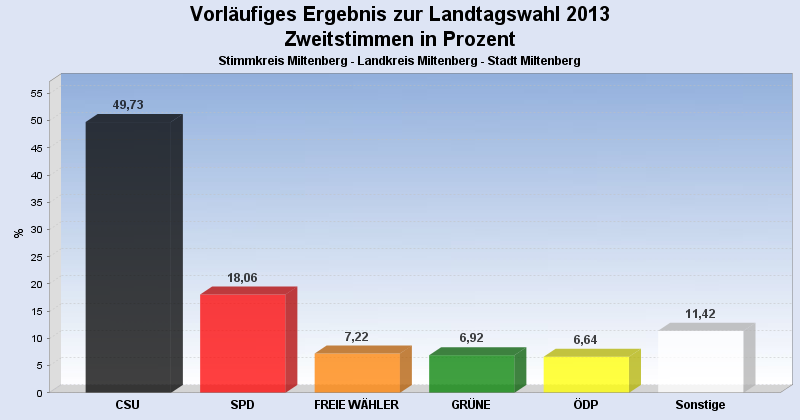
Wahlbeteiligung, Stimmzettel, Stimmen
| Wahlbeteiligung: | 59,70% |
|---|---|
| Stimmberechtigte: | 6.750 |
| Wähler: | 4.030 |
| Ungültige Erststimmen: | 50 |
| Gültige Erststimmen: | 3.980 |
| Ungültige Zweitstimmen: | 71 |
| Gültige Zweitstimmen: | 3.959 |
Erststimmen nach Wahlvorschlag
| Partei | Erststimmen | Prozent | |
|---|---|---|---|
| 1 | Rüth, Berthold ( CSU ) | 1.845 | 46,36% |
| 2 | Meyerer, Thorsten ( SPD ) | 819 | 20,58% |
| 3 | Schötterl, Bernd ( FREIE WÄHLER ) | 407 | 10,23% |
| 5 | Dr. Linduschka, Heinz ( FDP ) | 305 | 7,66% |
| 4 | Kreuzer, Hannelore ( GRÜNE ) | 244 | 6,13% |
| 7 | Scholz, Steffen ( ÖDP ) | 113 | 2,84% |
| 6 | Liebl, Georg ( DIE LINKE ) | 78 | 1,96% |
| 11 | Lührmann, Uwe ( PIRATEN ) | 73 | 1,83% |
| 8 | Goebel, Walter ( REP ) | 52 | 1,31% |
| 9 | Soder, Markus ( BP ) | 44 | 1,11% |
Zweitstimmen nach Wahlvorschlag
| Partei | Zweitstimmen | Prozent | |
|---|---|---|---|
| 1 | CSU | 1.969 | 49,73% |
| 2 | SPD | 715 | 18,06% |
| 3 | FREIE WÄHLER | 286 | 7,22% |
| 4 | GRÜNE | 274 | 6,92% |
| 7 | ÖDP | 263 | 6,64% |
| 5 | FDP | 187 | 4,72% |
| 11 | PIRATEN | 73 | 1,84% |
| 6 | DIE LINKE | 67 | 1,69% |
| 8 | REP | 59 | 1,49% |
| 10 | DIE FRANKEN | 40 | 1,01% |
| 9 | BP | 26 | 0,66% |
- Stand: 16.09.2013 15:15:51