Vorläufiges Ergebnis zur Landtagswahl 2013 am 15.09.2013
Stimmkreis Miltenberg - Landkreis Miltenberg - Gemeinde Mömlingen
Es wurden alle Stimmbezirke ausgewertet.
 Diagramm
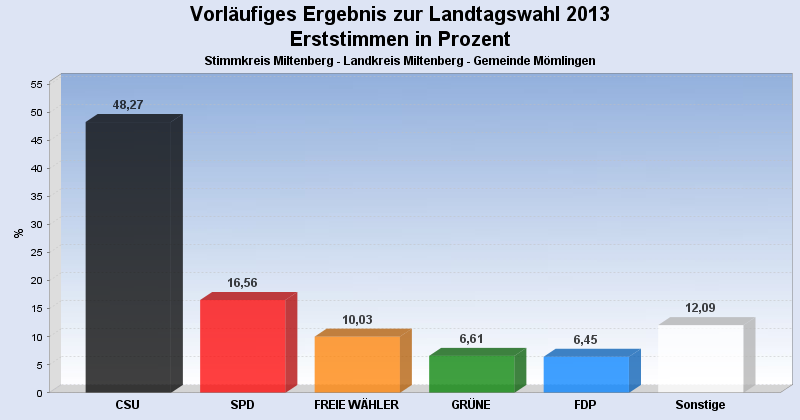
 Seitenanfang
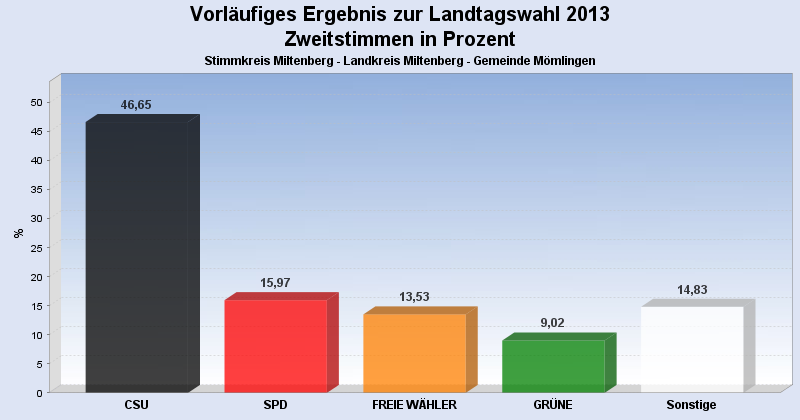
Wahlbeteiligung, Stimmzettel, Stimmen
| Wahlbeteiligung: | 65,86% |
|---|---|
| Stimmberechtigte: | 3.843 |
| Wähler: | 2.531 |
| Ungültige Erststimmen: | 49 |
| Gültige Erststimmen: | 2.482 |
| Ungültige Zweitstimmen: | 70 |
| Gültige Zweitstimmen: | 2.461 |
Erststimmen nach Wahlvorschlag
| Partei | Erststimmen | Prozent | |
|---|---|---|---|
| 1 | Rüth, Berthold ( CSU ) | 1.198 | 48,27% |
| 2 | Meyerer, Thorsten ( SPD ) | 411 | 16,56% |
| 3 | Schötterl, Bernd ( FREIE WÄHLER ) | 249 | 10,03% |
| 4 | Kreuzer, Hannelore ( GRÜNE ) | 164 | 6,61% |
| 5 | Dr. Linduschka, Heinz ( FDP ) | 160 | 6,45% |
| 8 | Goebel, Walter ( REP ) | 93 | 3,75% |
| 6 | Liebl, Georg ( DIE LINKE ) | 60 | 2,42% |
| 7 | Scholz, Steffen ( ÖDP ) | 58 | 2,34% |
| 11 | Lührmann, Uwe ( PIRATEN ) | 54 | 2,18% |
| 9 | Soder, Markus ( BP ) | 35 | 1,41% |
Zweitstimmen nach Wahlvorschlag
| Partei | Zweitstimmen | Prozent | |
|---|---|---|---|
| 1 | CSU | 1.148 | 46,65% |
| 2 | SPD | 393 | 15,97% |
| 3 | FREIE WÄHLER | 333 | 13,53% |
| 4 | GRÜNE | 222 | 9,02% |
| 7 | ÖDP | 81 | 3,29% |
| 8 | REP | 73 | 2,97% |
| 5 | FDP | 65 | 2,64% |
| 11 | PIRATEN | 56 | 2,28% |
| 6 | DIE LINKE | 45 | 1,83% |
| 9 | BP | 24 | 0,98% |
| 10 | DIE FRANKEN | 21 | 0,85% |
- Stand: 16.09.2013 15:15:55