Vorläufiges Ergebnis zur Landtagswahl 2013 am 15.09.2013
Stimmkreis Miltenberg - Landkreis Miltenberg - Markt Sulzbach a.Main
Es wurden alle Stimmbezirke ausgewertet.
 Diagramm
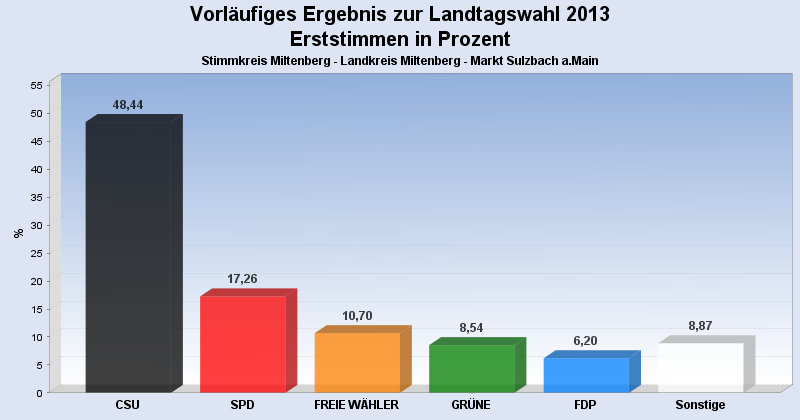
 Seitenanfang
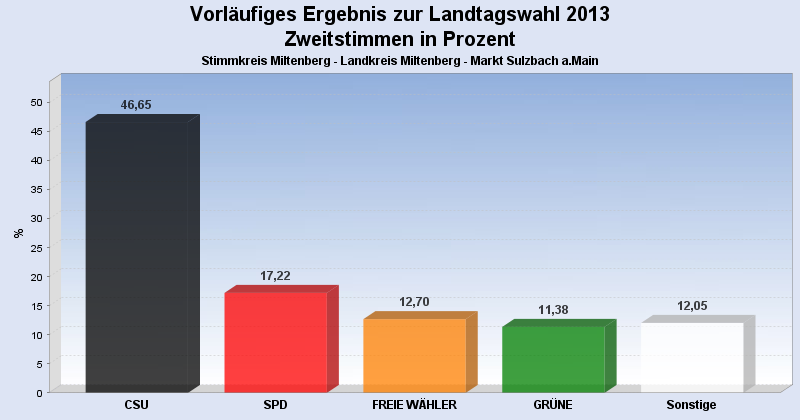
Wahlbeteiligung, Stimmzettel, Stimmen
| Wahlbeteiligung: | 61,85% |
|---|---|
| Stimmberechtigte: | 5.413 |
| Wähler: | 3.348 |
| Ungültige Erststimmen: | 57 |
| Gültige Erststimmen: | 3.291 |
| Ungültige Zweitstimmen: | 96 |
| Gültige Zweitstimmen: | 3.252 |
Erststimmen nach Wahlvorschlag
| Partei | Erststimmen | Prozent | |
|---|---|---|---|
| 1 | Rüth, Berthold ( CSU ) | 1.594 | 48,44% |
| 2 | Meyerer, Thorsten ( SPD ) | 568 | 17,26% |
| 3 | Schötterl, Bernd ( FREIE WÄHLER ) | 352 | 10,70% |
| 4 | Kreuzer, Hannelore ( GRÜNE ) | 281 | 8,54% |
| 5 | Dr. Linduschka, Heinz ( FDP ) | 204 | 6,20% |
| 6 | Liebl, Georg ( DIE LINKE ) | 76 | 2,31% |
| 9 | Soder, Markus ( BP ) | 64 | 1,94% |
| 11 | Lührmann, Uwe ( PIRATEN ) | 61 | 1,85% |
| 8 | Goebel, Walter ( REP ) | 46 | 1,40% |
| 7 | Scholz, Steffen ( ÖDP ) | 45 | 1,37% |
Zweitstimmen nach Wahlvorschlag
| Partei | Zweitstimmen | Prozent | |
|---|---|---|---|
| 1 | CSU | 1.517 | 46,65% |
| 2 | SPD | 560 | 17,22% |
| 3 | FREIE WÄHLER | 413 | 12,70% |
| 4 | GRÜNE | 370 | 11,38% |
| 5 | FDP | 122 | 3,75% |
| 11 | PIRATEN | 63 | 1,94% |
| 9 | BP | 47 | 1,45% |
| 6 | DIE LINKE | 46 | 1,41% |
| 7 | ÖDP | 44 | 1,35% |
| 8 | REP | 43 | 1,32% |
| 10 | DIE FRANKEN | 27 | 0,83% |
- Stand: 16.09.2013 15:16:14