Vorläufiges Ergebnis zur Landtagswahl 2013 am 15.09.2013
Stimmkreis Miltenberg - Landkreis Miltenberg - Stadt Amorbach
Es wurden alle Stimmbezirke ausgewertet.
 Diagramm
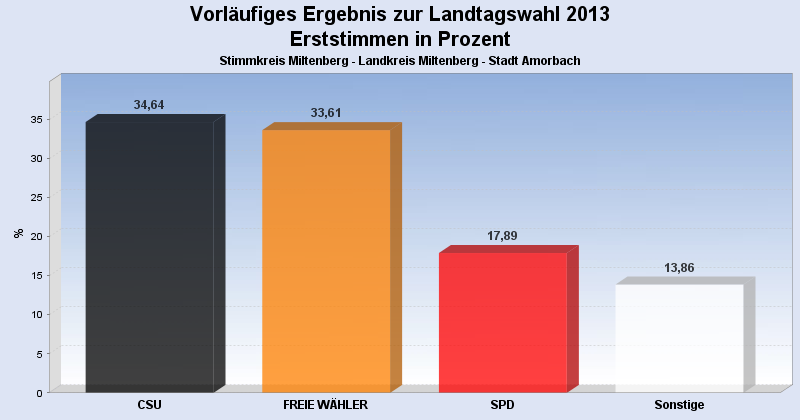
 Seitenanfang
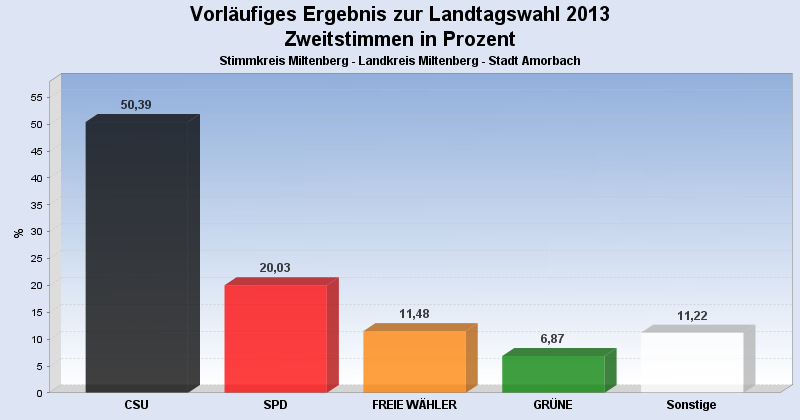
Wahlbeteiligung, Stimmzettel, Stimmen
| Wahlbeteiligung: | 63,96% |
|---|---|
| Stimmberechtigte: | 3.072 |
| Wähler: | 1.965 |
| Ungültige Erststimmen: | 31 |
| Gültige Erststimmen: | 1.934 |
| Ungültige Zweitstimmen: | 58 |
| Gültige Zweitstimmen: | 1.907 |
Erststimmen nach Wahlvorschlag
| Partei | Erststimmen | Prozent | |
|---|---|---|---|
| 1 | Rüth, Berthold ( CSU ) | 670 | 34,64% |
| 3 | Schötterl, Bernd ( FREIE WÄHLER ) | 650 | 33,61% |
| 2 | Meyerer, Thorsten ( SPD ) | 346 | 17,89% |
| 4 | Kreuzer, Hannelore ( GRÜNE ) | 91 | 4,71% |
| 5 | Dr. Linduschka, Heinz ( FDP ) | 66 | 3,41% |
| 6 | Liebl, Georg ( DIE LINKE ) | 28 | 1,45% |
| 11 | Lührmann, Uwe ( PIRATEN ) | 26 | 1,34% |
| 7 | Scholz, Steffen ( ÖDP ) | 23 | 1,19% |
| 8 | Goebel, Walter ( REP ) | 17 | 0,88% |
| 9 | Soder, Markus ( BP ) | 17 | 0,88% |
Zweitstimmen nach Wahlvorschlag
| Partei | Zweitstimmen | Prozent | |
|---|---|---|---|
| 1 | CSU | 961 | 50,39% |
| 2 | SPD | 382 | 20,03% |
| 3 | FREIE WÄHLER | 219 | 11,48% |
| 4 | GRÜNE | 131 | 6,87% |
| 7 | ÖDP | 65 | 3,41% |
| 5 | FDP | 47 | 2,46% |
| 11 | PIRATEN | 24 | 1,26% |
| 6 | DIE LINKE | 22 | 1,15% |
| 8 | REP | 19 | 1,00% |
| 9 | BP | 19 | 1,00% |
| 10 | DIE FRANKEN | 18 | 0,94% |
- Stand: 23.09.2013 14:09:30