Vorläufiges Ergebnis zur Landtagswahl 2013 am 15.09.2013
Stimmkreis Miltenberg - Landkreis Miltenberg - Gemeinde Collenberg
Es wurden alle Stimmbezirke ausgewertet.
 Diagramm
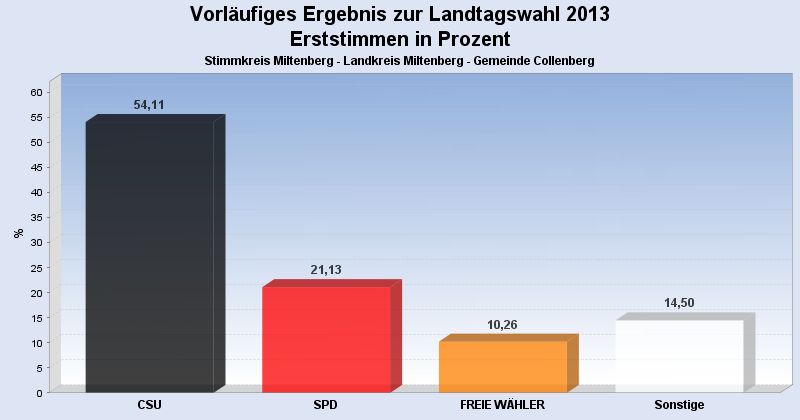
 Seitenanfang
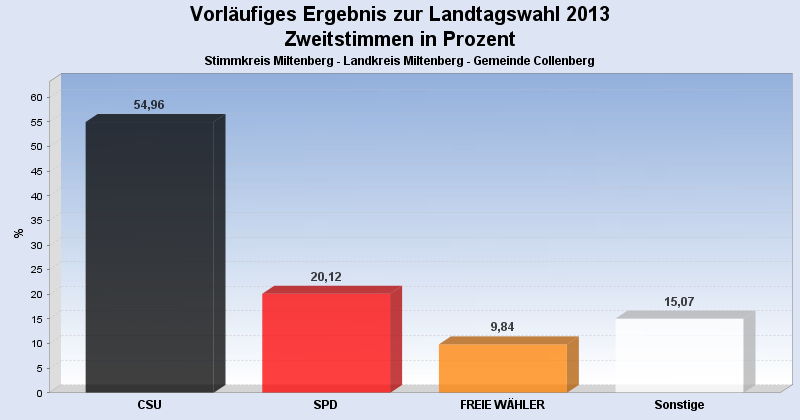
Wahlbeteiligung, Stimmzettel, Stimmen
| Wahlbeteiligung: | 61,48% |
|---|---|
| Stimmberechtigte: | 1.869 |
| Wähler: | 1.149 |
| Ungültige Erststimmen: | 18 |
| Gültige Erststimmen: | 1.131 |
| Ungültige Zweitstimmen: | 21 |
| Gültige Zweitstimmen: | 1.128 |
Erststimmen nach Wahlvorschlag
| Partei | Erststimmen | Prozent | |
|---|---|---|---|
| 1 | Rüth, Berthold ( CSU ) | 612 | 54,11% |
| 2 | Meyerer, Thorsten ( SPD ) | 239 | 21,13% |
| 3 | Schötterl, Bernd ( FREIE WÄHLER ) | 116 | 10,26% |
| 4 | Kreuzer, Hannelore ( GRÜNE ) | 41 | 3,63% |
| 5 | Dr. Linduschka, Heinz ( FDP ) | 34 | 3,01% |
| 8 | Goebel, Walter ( REP ) | 20 | 1,77% |
| 6 | Liebl, Georg ( DIE LINKE ) | 19 | 1,68% |
| 7 | Scholz, Steffen ( ÖDP ) | 18 | 1,59% |
| 9 | Soder, Markus ( BP ) | 17 | 1,50% |
| 11 | Lührmann, Uwe ( PIRATEN ) | 15 | 1,33% |
Zweitstimmen nach Wahlvorschlag
| Partei | Zweitstimmen | Prozent | |
|---|---|---|---|
| 1 | CSU | 620 | 54,96% |
| 2 | SPD | 227 | 20,12% |
| 3 | FREIE WÄHLER | 111 | 9,84% |
| 4 | GRÜNE | 54 | 4,79% |
| 5 | FDP | 26 | 2,30% |
| 7 | ÖDP | 18 | 1,60% |
| 8 | REP | 17 | 1,51% |
| 10 | DIE FRANKEN | 16 | 1,42% |
| 11 | PIRATEN | 15 | 1,33% |
| 6 | DIE LINKE | 13 | 1,15% |
| 9 | BP | 11 | 0,98% |
- Stand: 23.09.2013 14:09:32