Vorläufiges Ergebnis zur Landtagswahl 2013 am 15.09.2013
Stimmkreis Miltenberg - Landkreis Miltenberg - Stadt Erlenbach a.Main
Es wurden alle Stimmbezirke ausgewertet.
 Diagramm
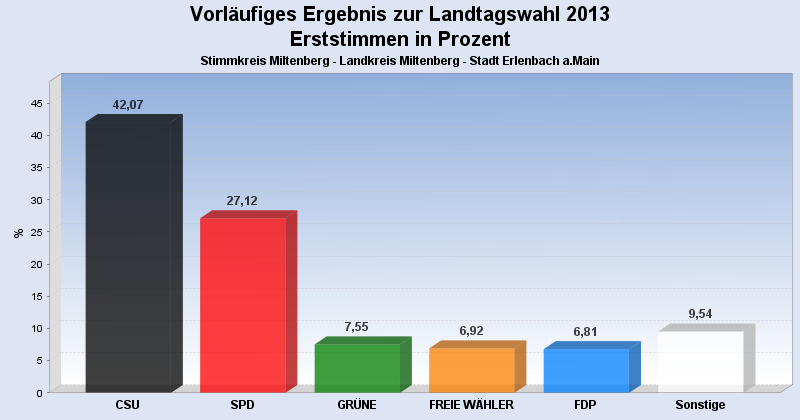
 Seitenanfang
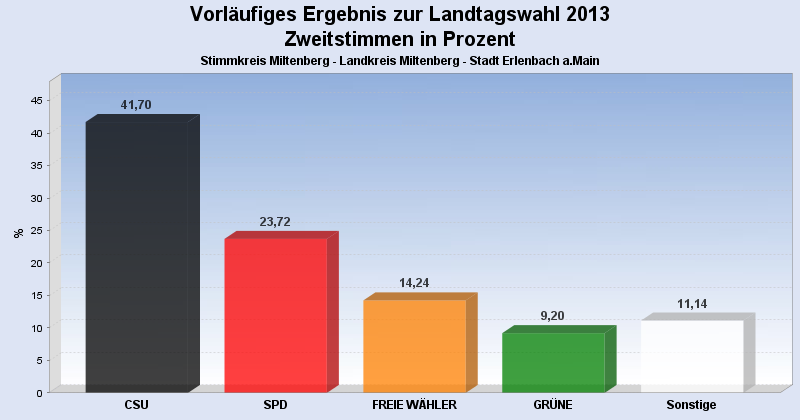
Wahlbeteiligung, Stimmzettel, Stimmen
| Wahlbeteiligung: | 55,51% |
|---|---|
| Stimmberechtigte: | 6.705 |
| Wähler: | 3.722 |
| Ungültige Erststimmen: | 64 |
| Gültige Erststimmen: | 3.658 |
| Ungültige Zweitstimmen: | 113 |
| Gültige Zweitstimmen: | 3.609 |
Erststimmen nach Wahlvorschlag
| Partei | Erststimmen | Prozent | |
|---|---|---|---|
| 1 | Rüth, Berthold ( CSU ) | 1.539 | 42,07% |
| 2 | Meyerer, Thorsten ( SPD ) | 992 | 27,12% |
| 4 | Kreuzer, Hannelore ( GRÜNE ) | 276 | 7,55% |
| 3 | Schötterl, Bernd ( FREIE WÄHLER ) | 253 | 6,92% |
| 5 | Dr. Linduschka, Heinz ( FDP ) | 249 | 6,81% |
| 6 | Liebl, Georg ( DIE LINKE ) | 89 | 2,43% |
| 7 | Scholz, Steffen ( ÖDP ) | 77 | 2,10% |
| 11 | Lührmann, Uwe ( PIRATEN ) | 73 | 2,00% |
| 8 | Goebel, Walter ( REP ) | 63 | 1,72% |
| 9 | Soder, Markus ( BP ) | 47 | 1,28% |
Zweitstimmen nach Wahlvorschlag
| Partei | Zweitstimmen | Prozent | |
|---|---|---|---|
| 1 | CSU | 1.505 | 41,70% |
| 2 | SPD | 856 | 23,72% |
| 3 | FREIE WÄHLER | 514 | 14,24% |
| 4 | GRÜNE | 332 | 9,20% |
| 5 | FDP | 96 | 2,66% |
| 11 | PIRATEN | 66 | 1,83% |
| 8 | REP | 62 | 1,72% |
| 6 | DIE LINKE | 61 | 1,69% |
| 7 | ÖDP | 53 | 1,47% |
| 10 | DIE FRANKEN | 37 | 1,03% |
| 9 | BP | 27 | 0,75% |
- Stand: 23.09.2013 14:09:37