Vorläufiges Ergebnis zur Landtagswahl 2013 am 15.09.2013
Stimmkreis Miltenberg - Landkreis Miltenberg - Gemeinde Niedernberg
Es wurden alle Stimmbezirke ausgewertet.
 Diagramm
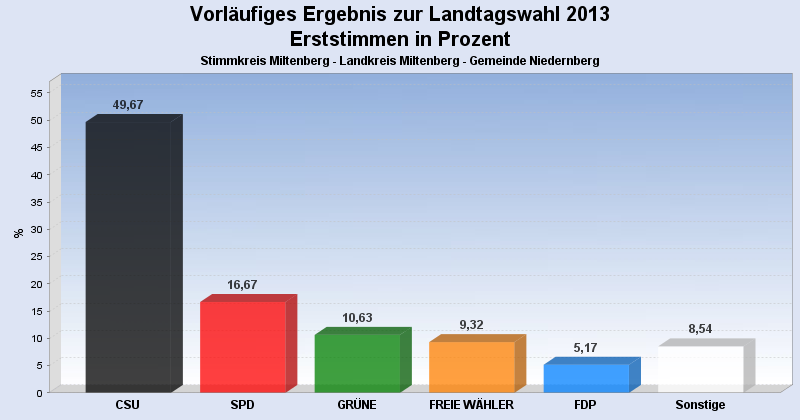
 Seitenanfang
Wahlbeteiligung, Stimmzettel, Stimmen
| Wahlbeteiligung: | 64,51% |
|---|---|
| Stimmberechtigte: | 3.826 |
| Wähler: | 2.468 |
| Ungültige Erststimmen: | 32 |
| Gültige Erststimmen: | 2.436 |
| Ungültige Zweitstimmen: | 55 |
| Gültige Zweitstimmen: | 2.413 |
Erststimmen nach Wahlvorschlag
| Partei | Erststimmen | Prozent | |
|---|---|---|---|
| 1 | Rüth, Berthold ( CSU ) | 1.210 | 49,67% |
| 2 | Meyerer, Thorsten ( SPD ) | 406 | 16,67% |
| 4 | Kreuzer, Hannelore ( GRÜNE ) | 259 | 10,63% |
| 3 | Schötterl, Bernd ( FREIE WÄHLER ) | 227 | 9,32% |
| 5 | Dr. Linduschka, Heinz ( FDP ) | 126 | 5,17% |
| 11 | Lührmann, Uwe ( PIRATEN ) | 57 | 2,34% |
| 6 | Liebl, Georg ( DIE LINKE ) | 52 | 2,13% |
| 8 | Goebel, Walter ( REP ) | 39 | 1,60% |
| 9 | Soder, Markus ( BP ) | 35 | 1,44% |
| 7 | Scholz, Steffen ( ÖDP ) | 25 | 1,03% |
Zweitstimmen nach Wahlvorschlag
| Partei | Zweitstimmen | Prozent | |
|---|---|---|---|
| 1 | CSU | 1.167 | 48,36% |
| 2 | SPD | 420 | 17,41% |
| 4 | GRÜNE | 317 | 13,14% |
| 3 | FREIE WÄHLER | 217 | 8,99% |
| 5 | FDP | 80 | 3,32% |
| 11 | PIRATEN | 49 | 2,03% |
| 6 | DIE LINKE | 45 | 1,86% |
| 8 | REP | 40 | 1,66% |
| 9 | BP | 31 | 1,28% |
| 7 | ÖDP | 29 | 1,20% |
| 10 | DIE FRANKEN | 18 | 0,75% |
- Stand: 23.09.2013 14:10:04