Vorläufiges Ergebnis zur Landtagswahl 2013 am 15.09.2013
Stimmkreis Miltenberg - Landkreis Miltenberg - Gemeinde Röllbach
Es wurden alle Stimmbezirke ausgewertet.
 Diagramm
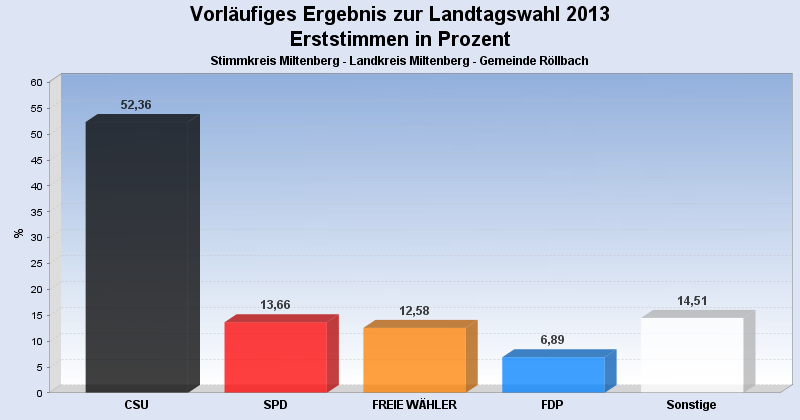
 Seitenanfang
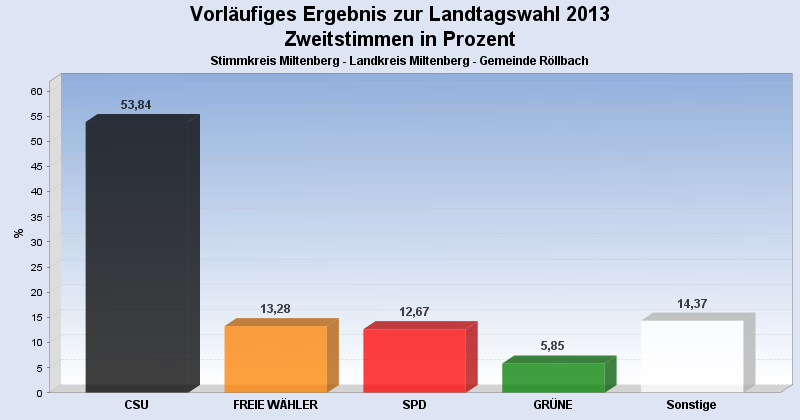
Wahlbeteiligung, Stimmzettel, Stimmen
| Wahlbeteiligung: | 65,28% |
|---|---|
| Stimmberechtigte: | 1.296 |
| Wähler: | 846 |
| Ungültige Erststimmen: | 19 |
| Gültige Erststimmen: | 827 |
| Ungültige Zweitstimmen: | 25 |
| Gültige Zweitstimmen: | 821 |
Erststimmen nach Wahlvorschlag
| Partei | Erststimmen | Prozent | |
|---|---|---|---|
| 1 | Rüth, Berthold ( CSU ) | 433 | 52,36% |
| 2 | Meyerer, Thorsten ( SPD ) | 113 | 13,66% |
| 3 | Schötterl, Bernd ( FREIE WÄHLER ) | 104 | 12,58% |
| 5 | Dr. Linduschka, Heinz ( FDP ) | 57 | 6,89% |
| 4 | Kreuzer, Hannelore ( GRÜNE ) | 36 | 4,35% |
| 6 | Liebl, Georg ( DIE LINKE ) | 26 | 3,14% |
| 7 | Scholz, Steffen ( ÖDP ) | 21 | 2,54% |
| 11 | Lührmann, Uwe ( PIRATEN ) | 15 | 1,81% |
| 9 | Soder, Markus ( BP ) | 14 | 1,69% |
| 8 | Goebel, Walter ( REP ) | 8 | 0,97% |
Zweitstimmen nach Wahlvorschlag
| Partei | Zweitstimmen | Prozent | |
|---|---|---|---|
| 1 | CSU | 442 | 53,84% |
| 3 | FREIE WÄHLER | 109 | 13,28% |
| 2 | SPD | 104 | 12,67% |
| 4 | GRÜNE | 48 | 5,85% |
| 7 | ÖDP | 32 | 3,90% |
| 11 | PIRATEN | 20 | 2,44% |
| 5 | FDP | 19 | 2,31% |
| 6 | DIE LINKE | 17 | 2,07% |
| 8 | REP | 17 | 2,07% |
| 9 | BP | 8 | 0,97% |
| 10 | DIE FRANKEN | 5 | 0,61% |
- Stand: 23.09.2013 14:10:08