Vorläufiges Ergebnis zur Landtagswahl 2013 am 15.09.2013
Stimmkreis Miltenberg - Landkreis Miltenberg - Stadt Wörth a.Main
Es wurden alle Stimmbezirke ausgewertet.
 Diagramm
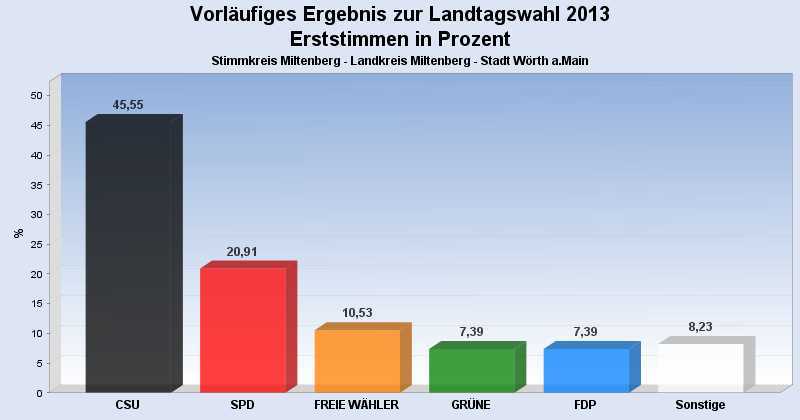
 Seitenanfang
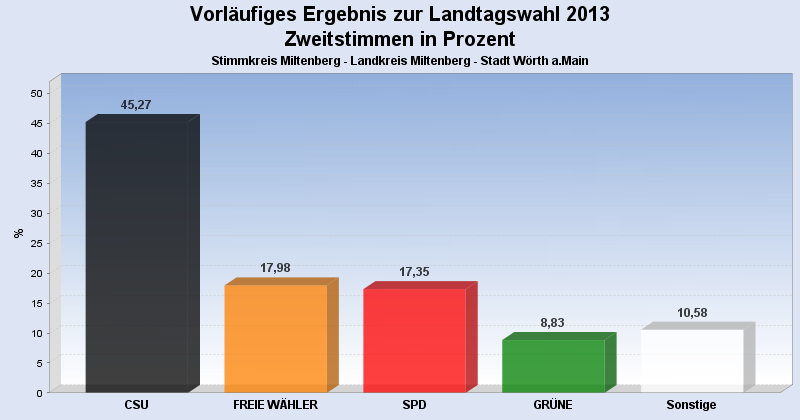
Wahlbeteiligung, Stimmzettel, Stimmen
| Wahlbeteiligung: | 58,03% |
|---|---|
| Stimmberechtigte: | 3.333 |
| Wähler: | 1.934 |
| Ungültige Erststimmen: | 26 |
| Gültige Erststimmen: | 1.908 |
| Ungültige Zweitstimmen: | 43 |
| Gültige Zweitstimmen: | 1.891 |
Erststimmen nach Wahlvorschlag
| Partei | Erststimmen | Prozent | |
|---|---|---|---|
| 1 | Rüth, Berthold ( CSU ) | 869 | 45,55% |
| 2 | Meyerer, Thorsten ( SPD ) | 399 | 20,91% |
| 3 | Schötterl, Bernd ( FREIE WÄHLER ) | 201 | 10,53% |
| 4 | Kreuzer, Hannelore ( GRÜNE ) | 141 | 7,39% |
| 5 | Dr. Linduschka, Heinz ( FDP ) | 141 | 7,39% |
| 6 | Liebl, Georg ( DIE LINKE ) | 40 | 2,10% |
| 11 | Lührmann, Uwe ( PIRATEN ) | 39 | 2,04% |
| 7 | Scholz, Steffen ( ÖDP ) | 32 | 1,68% |
| 8 | Goebel, Walter ( REP ) | 26 | 1,36% |
| 9 | Soder, Markus ( BP ) | 20 | 1,05% |
Zweitstimmen nach Wahlvorschlag
| Partei | Zweitstimmen | Prozent | |
|---|---|---|---|
| 1 | CSU | 856 | 45,27% |
| 3 | FREIE WÄHLER | 340 | 17,98% |
| 2 | SPD | 328 | 17,35% |
| 4 | GRÜNE | 167 | 8,83% |
| 5 | FDP | 43 | 2,27% |
| 11 | PIRATEN | 39 | 2,06% |
| 6 | DIE LINKE | 30 | 1,59% |
| 7 | ÖDP | 30 | 1,59% |
| 8 | REP | 28 | 1,48% |
| 9 | BP | 15 | 0,79% |
| 10 | DIE FRANKEN | 15 | 0,79% |
- Stand: 23.09.2013 14:10:14