Vorläufiges Ergebnis zur Landtagswahl 2013 am 15.09.2013
Stimmkreis Miltenberg - Landkreis Miltenberg - Gemeinde Leidersbach
Es wurden alle Stimmbezirke ausgewertet.
 Diagramm
 Seitenanfang
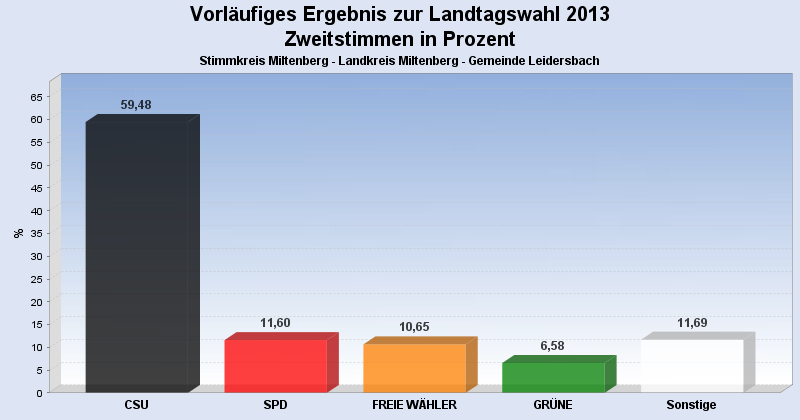
Wahlbeteiligung, Stimmzettel, Stimmen
| Wahlbeteiligung: | 65,17% |
|---|---|
| Stimmberechtigte: | 3.638 |
| Wähler: | 2.371 |
| Ungültige Erststimmen: | 47 |
| Gültige Erststimmen: | 2.324 |
| Ungültige Zweitstimmen: | 61 |
| Gültige Zweitstimmen: | 2.310 |
Erststimmen nach Wahlvorschlag
| Partei | Erststimmen | Prozent | |
|---|---|---|---|
| 1 | Rüth, Berthold ( CSU ) | 1.398 | 60,15% |
| 2 | Meyerer, Thorsten ( SPD ) | 264 | 11,36% |
| 3 | Schötterl, Bernd ( FREIE WÄHLER ) | 152 | 6,54% |
| 5 | Dr. Linduschka, Heinz ( FDP ) | 131 | 5,64% |
| 4 | Kreuzer, Hannelore ( GRÜNE ) | 127 | 5,46% |
| 6 | Liebl, Georg ( DIE LINKE ) | 107 | 4,60% |
| 9 | Soder, Markus ( BP ) | 55 | 2,37% |
| 8 | Goebel, Walter ( REP ) | 40 | 1,72% |
| 11 | Lührmann, Uwe ( PIRATEN ) | 31 | 1,33% |
| 7 | Scholz, Steffen ( ÖDP ) | 19 | 0,82% |
Zweitstimmen nach Wahlvorschlag
| Partei | Zweitstimmen | Prozent | |
|---|---|---|---|
| 1 | CSU | 1.374 | 59,48% |
| 2 | SPD | 268 | 11,60% |
| 3 | FREIE WÄHLER | 246 | 10,65% |
| 4 | GRÜNE | 152 | 6,58% |
| 5 | FDP | 63 | 2,73% |
| 9 | BP | 53 | 2,29% |
| 8 | REP | 45 | 1,95% |
| 6 | DIE LINKE | 41 | 1,77% |
| 11 | PIRATEN | 34 | 1,47% |
| 7 | ÖDP | 22 | 0,95% |
| 10 | DIE FRANKEN | 12 | 0,52% |
- Stand: 16.09.2013 15:15:48